Q1 2025 GitHub Innovation Graph Update: Trends in Data Visualization and AI Development
Kevin Xu’s Q1 2025 Innovation Graph update summarizes shifts in global open source development, with a special focus on AI’s rapid growth and the emergence of data visualization as a prominent repository topic.
Q1 2025 GitHub Innovation Graph Update: Trends in Data Visualization and AI Development
By Kevin Xu
The GitHub Innovation Graph continues to serve developers, researchers, and policymakers by offering transparent, real-world data on global patterns in public software development. As of March 2025, the dataset now spans more than five years, providing an in-depth look at trends powering the software economy.
Major Feature Updates
- Bar Chart Race Visualizations: Newly introduced bar chart race videos allow users to explore the evolution of global developer metrics for:
These dynamic visuals help illustrate how collaboration and development activity shift over time.
Topic Trends: Data Visualization and AI
- Data Visualization: The
data-visualizationrepository topic entered the global top 50 for the first time in Q1 2025, having steadily climbed from rank 100 in Q1 2020—a significant marker of increased interest among developers.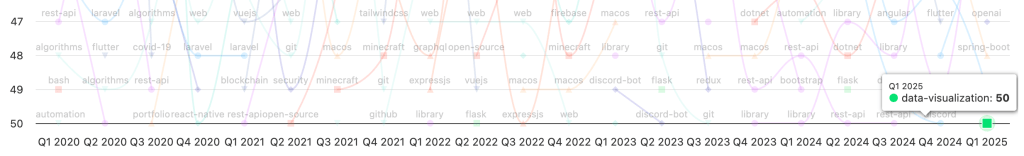
- Historical trends indicate a gradual, consistent rise with occasional rank fluctuations.
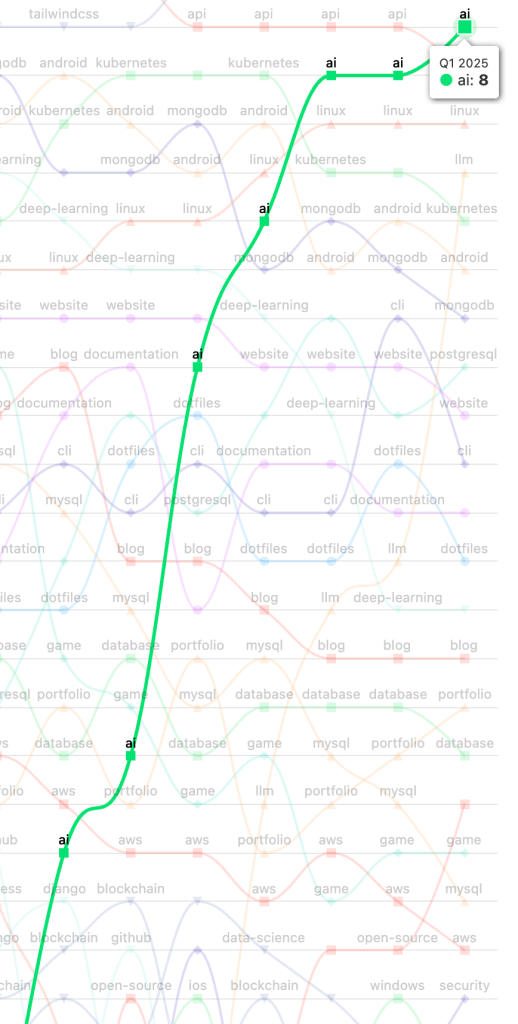
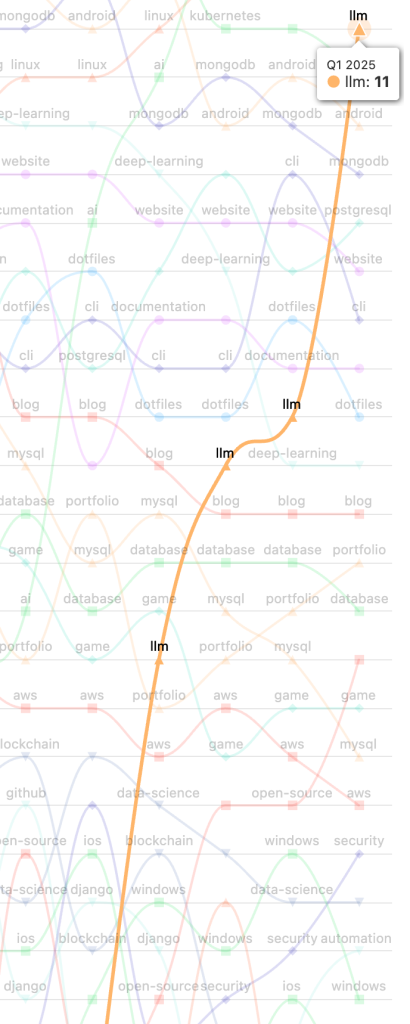
- AI and LLMs: Topics like
aiandllm(large language models) have surged to prominence—aimoved from rank 25 in Q3 2023 to rank 8 in Q1 2025;llmreached rank 11 in less than a year. This underscores the widespread adoption and development of advanced AI technologies on GitHub.
Research Roundup
The Innovation Graph is used across leading studies on software development and AI progress:
- 2025 AI Index Report (Stanford HAI)
- AI Index Report features GitHub data showing a sharp spike in AI-related public projects, especially in 2024. Section 1.6 dives deep into trends in public AI software projects over time.
- Corporate Accelerators and Entrepreneurial Growth
- Utilizes Innovation Graph data to measure regional technical labor capacity, finding startup successes tied to accelerator participation (SSRN paper).
- Software Work, Careers, and Language Use
- Assesses popularity and economics of different programming languages using StackOverflow and Innovation Graph data (arXiv preprint).
- Who is Using AI to Code?
- Finds that generative AI produced 30% of Python functions in US GitHub commits, raising overall commit volume and highlighting AI’s tangible impact on software output (arXiv preprint).
- Societal Capacity and AI Risks
- The Innovation Graph informs frameworks for societal resilience and transformation in the face of advanced AI (ICML Workshop paper).
Conclusion
The Q1 2025 Innovation Graph update highlights how data visualization and especially AI and LLMs are transforming open source software development on GitHub. The platform’s ongoing data releases and research collaborations provide practitioners with actionable insights into technology adoption and global developer dynamics.
This post appeared first on “The GitHub Blog”. Read the entire article here