Debugging with the AI-powered IEnumerable Visualizer in Visual Studio 2022
Junyu Wang introduces the AI-powered enhancements in Visual Studio 2022’s IEnumerable Visualizer, featuring Copilot Chat integration to streamline LINQ query debugging and refinement.
Debugging with the AI-powered IEnumerable Visualizer in Visual Studio 2022
Author: Junyu Wang
Are you tired of wrestling with complex LINQ queries during debugging? Visual Studio 2022 brings major improvements, powered by AI, to streamline this process through its enhanced editable expression feature in the IEnumerable Visualizer. These functionalities are designed to make debugging more intuitive and efficient—empowering you to write and refine LINQ queries with minimal friction.
The Challenge: Crafting Complex and Desired LINQ Expressions
LINQ queries are powerful but often intricate, demanding accurate syntax and iterative refinement. To address these pain points, Visual Studio introduces these key enhancements:
- Syntax Highlighting for editable expressions
- Inline Chat for quick, AI-assisted refinements
- GitHub Copilot Chat Integration for advanced querying help
Together, these features enable faster, more accurate debugging of projects involving large datasets.
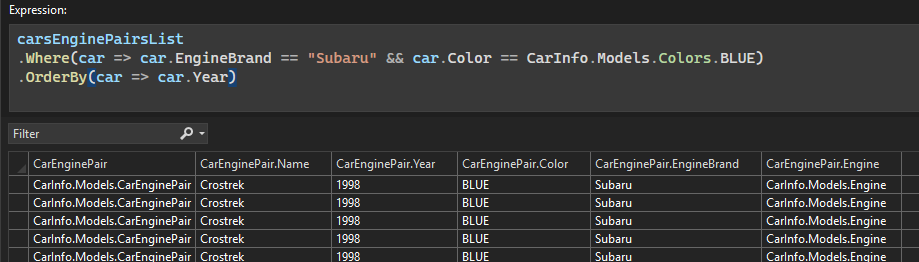
Syntax Highlighting for Editable Expressions
Readable code is easier to debug. The new syntax highlighting in the IEnumerable Visualizer’s editable expression section color-codes elements such as keywords, classes, enums, and structures. This visual aid helps developers quickly scan queries and identify issues.
How to Customize Syntax Highlighting
- Go to Tools > Options > Environment > Fonts and Colors.
- Select Text Editor in the Show settings for dropdown.
- Adjust color settings for User Types according to your preferences.
Example Visual:
Editable Expression Inline Copilot Chat
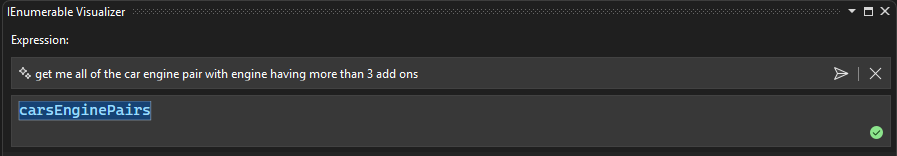
Beyond syntax highlighting, the IEnumerable Visualizer now features Inline Chat. Developers can access AI-powered assistance directly in the visualizer to craft or refine LINQ queries.
- Click the GitHub Copilot sparkle icon
 at the bottom-right of the expression box.
 - A prompt appears: “Describe how you want to refine your current expression.”
Example Visual:
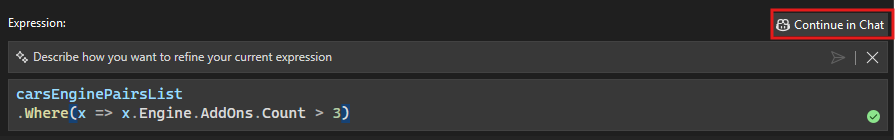
The AI (GitHub Copilot) generates a LINQ query from your prompt and executes it. The successful execution is indicated with a green checkmark. You can iteratively adjust your queries, using natural language to guide the AI in refining or changing your expression. Hitting the send arrow prompts Copilot to suggest new query updates.
Copilot Chat Integration for Deeper Debugging
For more sophisticated query refinement, Copilot Chat Integration offers a more interactive debugging experience. After an inline edit, a “Continue in Chat” option appears:
- Clicking this opens the Copilot Chat window for deeper discussion and advanced help.
- Within Chat, you can further refine the expression, ask additional questions, or explore alternatives.
Example Visuals:
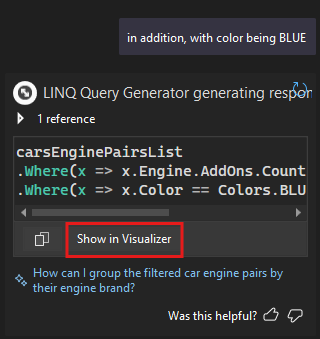
This feature also provides immediate feedback, enabling rapid creation and adjustment of complex filters and transformations. Once you’re satisfied, you can return the optimized query to the visualizer using the “Show in Visualizer” button so it applies directly to your debugging session.
- Inline Chat: For quick, in-context tweaks.
- Copilot Chat Integration: For more detailed, interactive troubleshooting and learning.
Example Visual:
Feedback-driven Improvement
Many of these features were developed in response to community feedback, including interviews and Developer Community suggestions. The goal is to reduce debugging time while enhancing productivity and clarity for developers—especially those working with large, complex data sets.
Keep sharing your insights and suggestions to help further improve Visual Studio’s AI-driven tools. The new editable expression feature aims to transform your debugging workflow and empower you with advanced AI capabilities right inside your IDE.
This post appeared first on “Microsoft DevBlog”. Read the entire article here